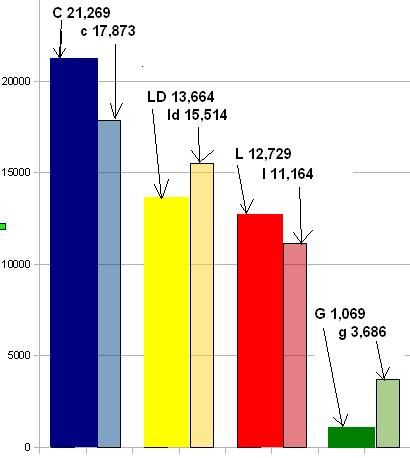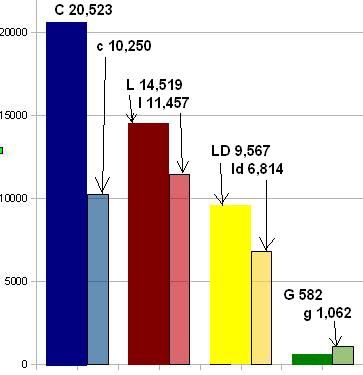
The solid colour is the General result, the transparent one is the Local.
As you can see, the Tories would have won in both cases. It looks like the LD came even further ahead of Lab in the locals (got that wrong first time, sorry, UPDATED). Look at how much better our result was in the Locals! More than 3 times the votes!
It backs up what some people were telling us, that they would vote Green locally, but not in the General. As Ukip and the independents didn't stand a full slate their results cant so easily be compared. Actually we were one ward short of a full slate, South Lake in Wokingham, so you can count on a few more votes for us. It was also 7.6%, more than enough to keep the deposit (5%).
So are locals a good predictor of a General Election? Its never precise, and as long as its understood to be an indicator, its ok. Its when people use it to say 'cant win here' that it gets me angry. And after the election, do you even hear an apology? "Actually voters we were wrong, they could have won, but hey anyone can make a mistake! Again" Because both Labour and LD leaflets claimed it to be a two horse race. Labour based on the 2005 GE, LD on local elections. I said at the time that both were wrong, and I was correct.
I had a look at the figures for Reading West, but it doesn't work so well, as there were no Local Elections this year in the West Berkshire Part of the constituency.

It shows Labour winning, but the part of the constituency missed out is more Tory. As before Ukip and the Common Sencers didnt stand a full slate, so cant be compared. Once more, our vote went up, not quite double.


5 comments:
Er, actually, Adrian, you've got the Labour and Liberal Democrat figures for the Reading East local results the wrong way round!
You might want to redo the article....
Oops, well spotter Gareth.
I have to point out, when we make a mistake, we admit it. When LD/Lab say its a two horse race, and its not, they don't. Or indeed Vote Clegg get Cameron. Double oops.
Er.
Exactly the same thing happened in Bristol.
We managed to keep our councillor, but dropped back in the General election.
http://www.bristol.gov.uk/item/elections/?XSL=main&ShowElectionWard=true&ElectionId=64&WardId=23
I did a similar exercise as I was interested as well although it occured to me that the parliamentary constituency boundaries are not the same as the council boundaries.
Did you take this into account on your graph?
Ed
Yes Ed, it does make it confusing. The wards in Reading East are :
Park
Abbey
Caversham
Church
Katesgrove
Peppard
Redlands
Thames (from RBC)
and
Bulmersh & Whitegates
Loddon
South Lake (from Wokingham Council)
Post a Comment