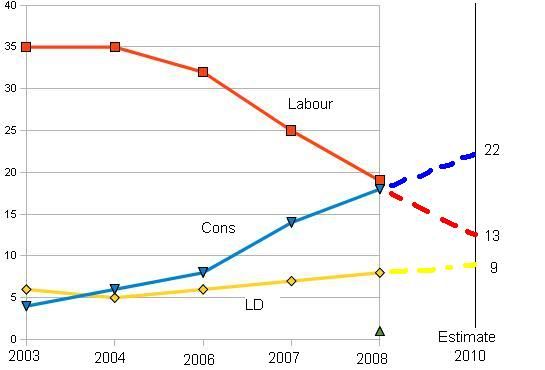
I was looking at trends in recent elections for Reading Cllrs, and thought I would plot the results. I make no predictions based on this, but as you can see from the trends, over the last few years Labour have lost about 6 a year, the Conservatives have gained 4 a year, and the LD have gained 1 a year.
As you can see I have shown on the chart what would happen if these trends continue, it results in Cons having 22 Cllrs (up4), Lab 13(down 6) & LD 9 (up 1).
At the moment we have a council with no overall control, Labour with the largest numbers (by 1) Lab 19, Cons 18, LD 8, Ind 1. If the trends continue as on the chart, we will have Cons the largest party 22, then Lab 13, LD 9 and I hope the Greens with our first 1. That would still be no overall control.
There is no certainty to how people will vote, trends over the last few years may reverse. Its possible for the any of the parties, including the Greens to win all 15 seats.
Looking on a ward by ward level, Lab have been strong in Abbey, Norcot, Southcote & Whitley. In Battle Lab have been strong and they have a good chance of gaining back the seat lost when Ind Tony Jones defected.
Cons have been strong in Caversham, Church, Kentwood, Peppard & Thames.
LD have been strong in Redlands & Tilehurst.
In Katesgrove the last 2 times the LD have gained from Labour, but its very tight. Similarly in Minster where Lab have been just ahead of Cons.
Park is where the Greens have a good chance of winning our first Council seat in Reading, in recent years Lab and Cons have also been strong there. There were only 20 votes in it last time.
Thanks to the General Election the locals are being slightly overlooked, but it may mean a higher turnout.


No comments:
Post a Comment