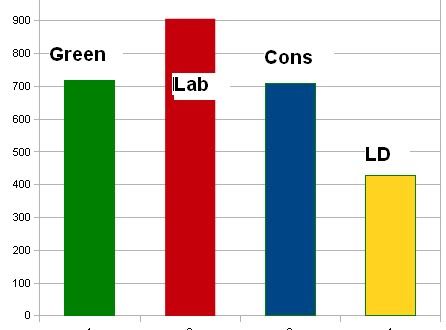
This is the average vote in Park ward over the last few years.
Why, I hear you ask, would anyone bother to do such a silly thing? The best measure of the local vote was the last local election. But, the LibDems have put out one of their famous dodgy bar charts, you know the type, it concludes 'they cant win here'. In the chart, the Greens don't seem to exist. In the fine print it says 'local election results in 2006, 2007 and 2008. Each time the Lib Dems beat Labour'.
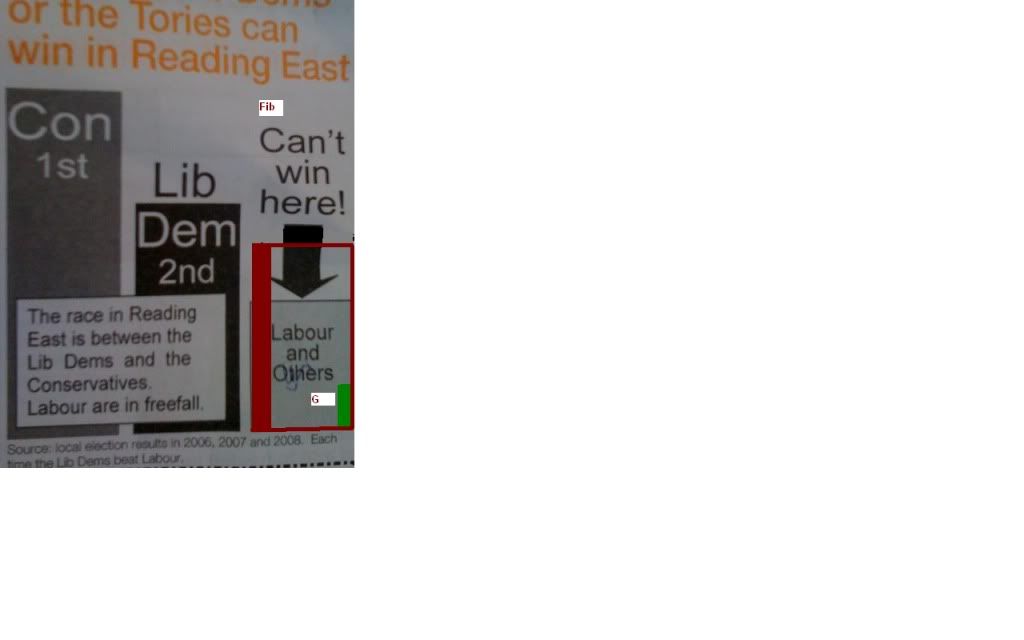
This leaflet was given out in Park Ward, with pics and information on the Park candidate. You can see where they have distorted the Lab vote and ignored the Greens entirely.
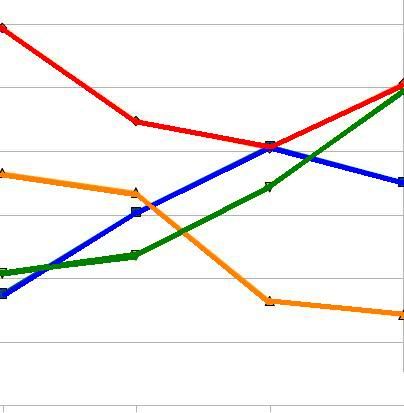
In Park Ward the LD have come last in the last two elections, so voters will wonder how they managed to beat Labour? The answer is you have to add up local election results from every ward in Reading East, though this is not helpful in Park, where the Lib Dem vote has sunk. As you can see from the lines in the chart below.
So here is the numbers that the LD want you to consider, look at how it compares to their one.
They have roughly represented Cons and LD votes (with just a bit of stretching), but where it says 'Lab and others', its actually just Lab (though rather shrunken).
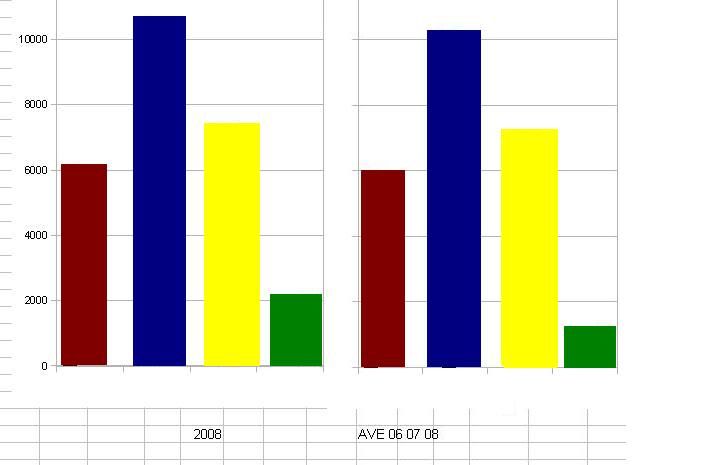
But the main fib is pretending that the average of three years will tell you anything interesting. It ignores any trends in that time. Its a bit like predicting the General Election with polls from the last 4 years, which would ignore the rise of Clegg in the last week. I cant see them doing that for some reason.
So for comparison I looked at the last local election results for Reading East wards, 2008.
Not much difference for the 3 big parties, but look at how the Green vote increases. So is that why they went for the average of three and not the most recent?
Of course local election results are just an indication, people vote differently in different elections. When you knock on doors people its not unusual for someone to say they will vote one way in the General, and another in the local.
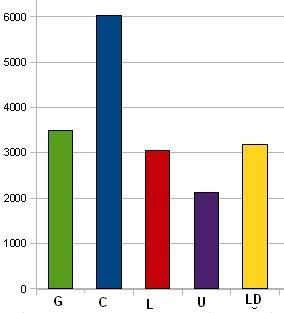
The LD say they don't like any comparison with last years Euro Election result, when the Greens did exceptionally well, as you can see below. (Please note, the date is from the 9 Reading Council wards, and doesn't include the 3 wards in Wokingham Council).
Many more examples exist of dodgy Lib Dem bar charts, a few links for you.


2 comments:
Yep, I got that LD leaflet and couldn't believe that they would produce something so utterly misleading.
Average vote? That's incredibly cheeky.
Here's one from Cardiff North. The technique: swap votes for council seats and pretend that the very disproportionate Labour representation on the council (zero) counts for anything relevant at Westminster:
http://adrianshort.co.uk/2010/04/27/how-to-lie-with-statistics-liberal-democrat-style/
Post a Comment